


This case study presents the design and implementation of IoT sensors and data visualization platform for Bornemann Gewindetechnik, a German manufacturer specializing in threaded spindles and precision components. The project involved retrofitting legacy manufacturing equipment with IoT capabilities, implementing a robust data streaming architecture based on MQTT, and developing advanced visualization interfaces for technical users to monitor machine states in real-time. This implementation transformed their traditional manufacturing facility into a "speaking machine" environment, significantly reducing downtime and improving production efficiency.
Business Context & Challenge
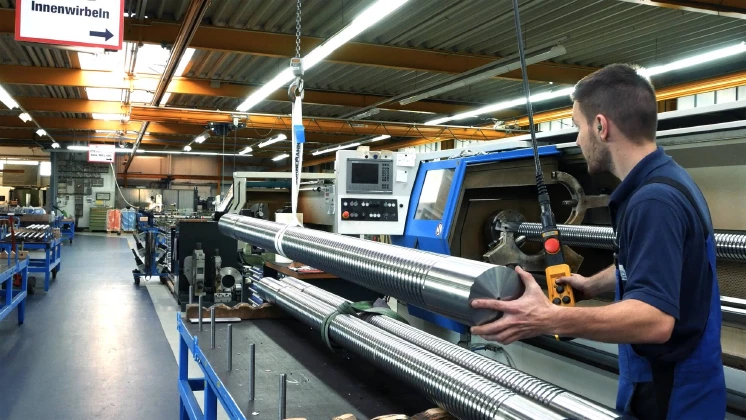
Client Profile
Bornemann Gewindetechnik GmbH & Co. KG is a specialized manufacturer of threaded spindles, custom screw threads, and precision components. Their production environment consisted of many legacy machines without built-in monitoring capabilities.
Key Challenges
- Reactive Maintenance: Production issues were only detected after failures occurred
- Limited Visibility: No real-time insights into machine states and performance metrics
- Disconnected Systems: Equipment from different manufacturers with no unified monitoring
- Technical Expertise Gap: Need for technical staff to interpret complex machine data
- Infrastructure Constraints: Required solution that worked with existing machinery
Business Goals
- Reduce machine downtime through early detection of potential issues
- Improve production planning through better visibility of machine utilization
- Enable technical staff to analyze performance patterns across multiple machines
- Achieve these goals without replacing expensive core manufacturing equipment
Users & Audience
The target users for the MQTT service are professional operators working in manufacturing companies. The users operates industry specific equipment such as CNC (computer numerical control) or SPC (statistical process control) machines, preferences on mobile and real time communication.
Team & Role
I coordinated all aspects of design including: information architecture, user task flows, interaction, visual, product, and prototyping. I also conducted user research with industry expert in order to address behavior and attitudes.

Problem-Solving Approach
- Research-driven design: "Every design decision was informed by deep research into the technical users' workflows and mental models.
- Iterative refinement: Improving and evolving through multiple iterations based on user testing and feedback.
- Technical constraints as opportunity: The limitations of legacy equipment pushed us to innovate in how we represented and visualized streaming data."
- Balance of power and usability: The challenge was creating interfaces that exposed powerful capabilities without overwhelming technical users.
Visualization Implementation for Technical Users
The visualization layer was specifically designed with technical users in mind, focusing on providing detailed insights while maintaining usability:
Service Integration
We took as example the user journey for creating the very first item (so called " topic"), identified the key specs that had to be included in the service, then mapped out user flows based on those specs (a lot of communication with developers and field expert was involved).
- Real-time Updates: Tech-Team Implemented WebSocket connections to visualize state changes with <200ms end-to-end latency

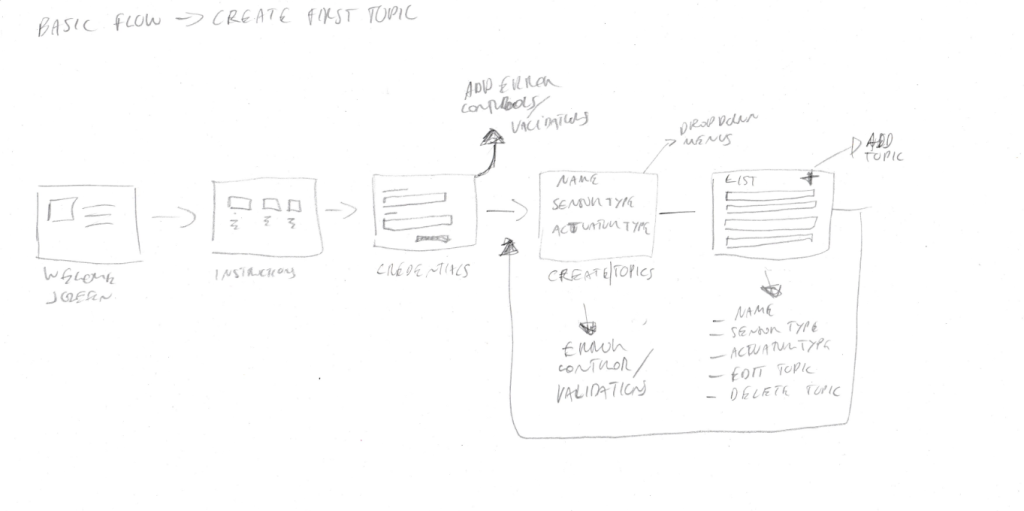
After several iterations we reached the final screens (Mobile version below). The goal was to keep the interface as clean as possible in order to enable the users to quickly and easily accomplish the tasks. An important part of the process was preventing the users to make errors and help them to visualize eventual mistakes before the final check with consequent time benefit.


Mobile version
Given the nature of this service, allowing users to receive real time notifications regarding a specific device, we built the interface to be responsive and to be easily used on mobile devices such tablet or smartphones. In doing so we extended the possibility to configure the service on different workstations.


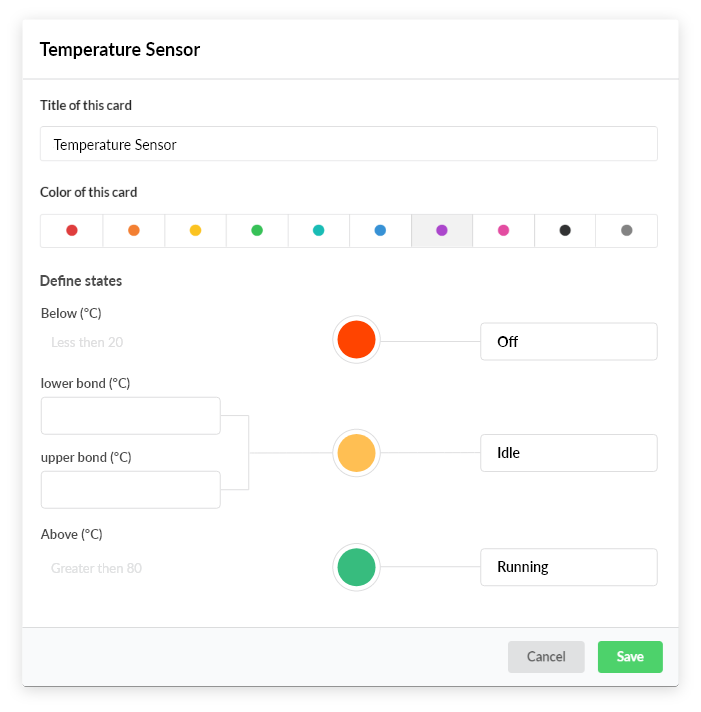
MQTT service configuration
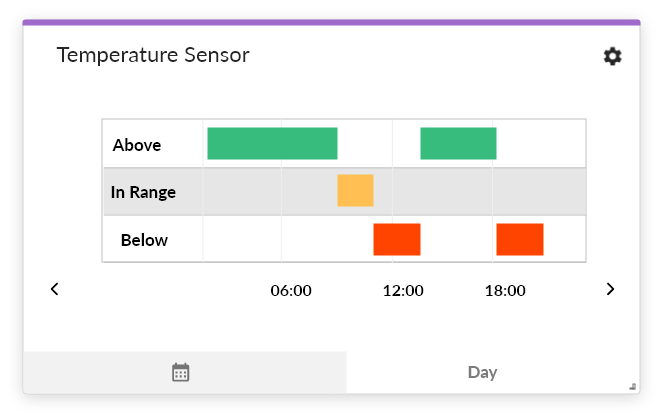
State History Widget
- Time-series Visualization: it creates interactive timeline views showing machine states with configurable time resolution
- State Transition Analysis: Built visual tools to analyze frequency and duration of state transitions:
- Operating states (running, idle, off)
- Performance parameters (temperature, power consumption, proximity)
- Interactive Analysis Features:
- Time range selection with dynamic resolution adjustment
- Threshold configuration with visual indicators
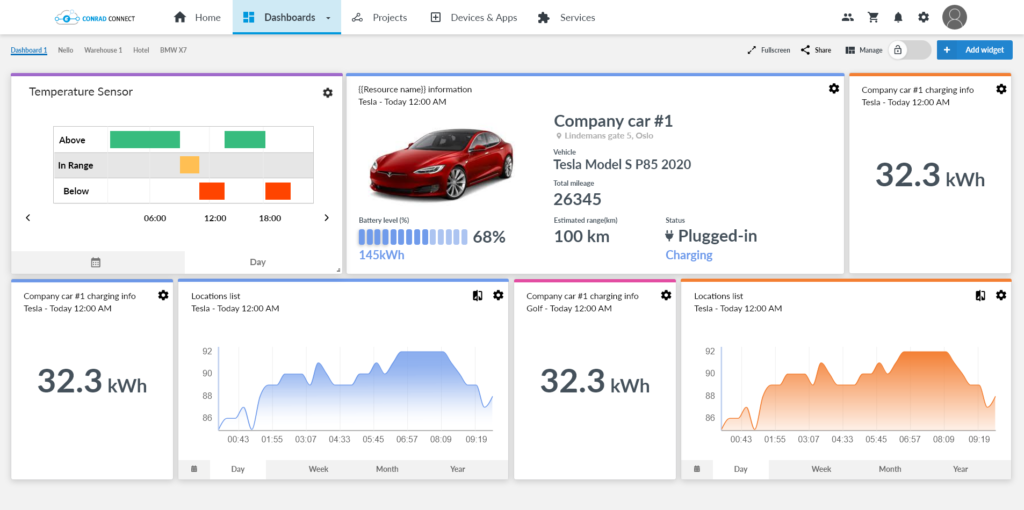
Technical Dashboard Implementation
Technical Dashboard Implementation
The dashboard system provided comprehensive visibility for technical users:
- Customizable Layouts: Created flexible dashboard system allowing technical staff to build specialized views
- Multi-level Visualization: Implemented drill-down capabilities from factory overview to individual sensor data
- Comparative Analysis: Designed tools for side-by-side comparison of multiple machines
- Historical Replay: Built functionality to replay historical events for incident analysis
- Alert Integration: Visual indicators for active alerts with severity levels
- Mobile Responsiveness: Ensured dashboards worked on tablets used by floor staff
- Collaborative Features: Added annotation capabilities for communicating about specific events


Results & Impact:
The true measure of success was generating real business impact. After six months of implementation:
- Unplanned downtime decreased by 32%, saving approximately €1.2 million annually
- Maintenance efficiency improved by 45% through better issue diagnosis
- Technical staff adoption reached 95% within two months
- The system now processes over 4 million events daily from 120+ sensors
- "Perhaps most significant was the cultural shift from reactive to proactive maintenance - engineers now have the tools to identify and address issues before they cause production failures."
But the numbers don't tell the whole story.
Beyond the metrics, the most significant outcome was a cultural shift from reactive to proactive and predictive maintenance. Engineers now have tools that match their expertise, enabling them to apply their knowledge before problems occur rather than after failures happen."
Key Takeaways
First, the power of co-creation with technical experts. By designing with engineers rather than for them, we created tools that truly fit their mental models and workflows.
Second, the importance of systemic thinking. Each interface component needed to work as part of a coherent whole, forming a complete data story from sensor to insight.